Making maps without getting lost
This is a story about creating an interactive tile-based map of a fictional island from a video game. It goes through the inception of an idea, self-imposed constraints, and staying focused on delivery. There’s enough discovery, intellectual rabbit holes and ruthless pragmatism to turn any casual hobby into an existential crisis.
Inception #
I recently picked up Arma Reforger and I’ve been enjoying the chaos of its 120 player online mode. The Arma series of games have always been positioned more as a Milsim (military simulation) rather than a classic first-person shooter like Battlefield or Call of Duty. One of the hardest aspects of the game’s steep learning curve is map knowledge. New players swiftly discover that there’s no ability to see where they are on the vast 13km by 13km map. You’re instantly lost, and it’s very disorientating.
Over time you build up a visual familiarity with your surroundings, and after a few weeks of playing you start to recognise the frequently used roads and landmark buildings. Alongside this map knowledge is familiarity with the location of supply caches which play an important role in the game mechanics. These supplies form the backbone of the in-game economy of both teams. If your team’s bases don’t have sufficient supplies, you can’t purchase vehicles or specialised equipment, you can’t extend the bases with new structures, and in dire situations, you won’t even be able to respawn at them.
You sometimes stumble on these supply caches yourself, and sometimes other players show you while you’re playing, but this knowledge is harder to acquire. The caches can range from large and obvious brown shipping containers to wooden crates stuffed in the attics of some very unassuming houses.

After some weeks of playing, it occurred to me that having a map on a second screen as you play would be incredibly useful, so thought it’d make a fun side project.
I didn’t want to walk around and scout them out manually; they would need to be 100% procedurally created. I’d have to derive all the locations of caches, not to mention the game map itself, from within the game’s data.
To do so, I’d have to work within the Reforger game engine, implement some command-line image processing, and ultimately bring everything together using a browser-based JavaScript map framework.
I wanted this to be a short project, with minimal distractions. If interesting coding or data problems came up during the work, it was important to be pragmatic and stay focussed on shipping version one. In this post we’ll go through the problems I had to solve along the way, and the approach I took.
- Deconstruction
- The Enfusion Workbench
- Cropping map tiles
- Implementing LeafletJS
- Zoom levels
- Map stats
- Extracting location data
- The finished map
- Some topographic fun
- Conclusion
Deconstruction #
The joy of a project like this is the polydisciplinary nature. No one single aspect of the work is likely to be be particularly difficult. However, each of the stages require working in a different domain, with different languages and different libraries, and all stages must be implemented for the project to deliver on its promise.
Another enticing aspect of a project like this is to create a genuinely useful public tool, and it’s always fun to give back to a community you enjoy being a part of.
You begin thinking about a project like this by working backwards. The interface for the tool I want is going to be something like Google Maps. Web browsers can display these really well, and it can work on any size screen. If you want to make a map website you need map tiles to display, and coordinate data to dictate where we place the map pins. To get hold of both these elements I need to start with the game engine.
Arma Reforger’s open developer tools are common aspect of all Bohemia Interactive’s games. I’d done some light modding work for Arma 3 over 12 years ago, but the technology has been completely overhauled since then, so I’ll effectively be starting from scratch.
Now let’s put the steps back in the right order:
First I’ll need to dive into the most unknown part of the project, the game engine.
The Enfusion Workbench #
The Enfusion Engine is a cross-platform engine using Qt for the interface, implementing a scripting language called Enforce Script. As far as I know this is entirely their own creation, and not derived from any specific base language. Thankfully it’s reasonably C-like, so it’s not too difficult to get up to speed with.
The development tools are accessible via Steam. It’s a single application with multiple windowed sub-applications that are tailored to specific tasks like modelling, scripting, audio, particle systems etc. I’m focusing on the World Editor and the Script Editor as these are the sub-application which load and render the game worlds, and the main scripting IDE respectively.
The first thing to do is load up one of the game worlds and look to see whether the supply caches are present in the map data, or whether they are instantiated at runtime. If we can see them in the offline map it’s going to be a lot easier to work with.

Yep, there they are! Now let’s turn our attention to the map. Maybe there’s an existing way to export topographical data we can use for our map tiles? Looking around the editor there are various mentions of likely tools like Map Exporter, Export Map data, Export Geographic data. The only one that seems to produce an image is the Export Map data tool. It has three modes of operation, and the two of interest are RASTERIZATION and GEOMETRY_2D.

Running it in RASTERIZATION mode exports a large 4096 x 4096 px texture which forms a base map used inside the game, and you can see that above. In the game it’s also composited with vector information detailing forested areas, the road and path network, and some building data. This vector data is exported to a .topo file, but unfortunately there’s no documentation on the format for this file.
Ok, so there are no existing maps which fit the requirements. Time for Plan B; let’s write our own map tile exporter!
Looking at the documentation and sample applications it’s possible to script the position and orientation of the editor camera fairly easily, as well as capturing output images to disk. Unfortunately there is no control over the perspective matrix, which means there’s no way to make it orthographic, and we’ll have issues relating to perspective.
// Get World Editor module
WorldEditor worldEditor = Workbench.GetModule(WorldEditor);
// Get World Editor API
WorldEditorAPI api = worldEditor.GetApi();
// Position the camera 1 km up, looking down
vector camPos = Vector(3000, 1000, 3000);
vector lookVec = Vector(0, -90, 0);
api.SetCamera(camPos, lookVec);
// Now create the screenshot
System.MakeScreenshot("test");
// we now have a 'test.png' file
If we can’t eliminate issues with perspective, then we need to minimise them, so let’s emulate real-world satellite data. If we position the camera far up, and with a very narrow FOV, we can compress the resulting perspective distortion as much as possible. The balancing act here is having a narrow FOV without fighting against the engine’s desire to enforce Level of Detail restrictions on how many and how well every object is rendered. Zoom in too much and you can ruin the visual fidelity.
A vertical FOV of 15 degrees offers a good mix of fidelity vs granularity. It gives us approximately 20 cm per pixel in the resulting image, which is enough to resolve terrain features you’ll encounter while walking or driving around the map.
Control over the camera is very restricted, and it’s not possible to control the field of view or far plane distance via scripting. Part of our process will require the user to set up some camera parameters manually, but luckily it can persist across sessions, making it less of a source of potential error.

The process to capture the images is straightforward, but consumes a lot of disk space. This is partly due to the difficulty of controlling the size of the camera window within the editor, and therefore the size of the output screenshot. The only consistent and reliable way to control this is to put the camera into full-screen mode with the F11 key, which then makes the screenshots the same size as my monitor resolution, 2560 x 1440 px. It captures a lot more data than we require, but again it’s about making this process repeatable in a regime where you can’t have the script enforce the capture parameters.
We’ll be moving the camera across the island in two nested loops, one for the X axis, and one for Z. We want to traverse across the 13 km of each axis in 100-metre steps, which means 16,900 steps in total. That’s a lot, so we need to make the capture process capable of detecting existing screenshots, and skipping over that position. This will save us a lot of needless repetition as we stop and start the process during development.
We can also make this process detect the cropped tile from the screenshot using a _tile.png suffix, meaning that we can delete the original screenshots once we’ve cropped them. This will help keep the intermediate disk usage down. Every screenshot is around 6 MB, which means our total intermediate disk usage will be nearly 100 GB. Did I mention I was short on disk space during this project? I became a bit obsessed with storage efficiency!
The last trick of camera movement is to make the camera stay at a fixed height relative to the terrain surface. This ensures that perspective artefacts that make edge discontinuities are minimised when travelling over areas of rapid height change.
Capturing this data takes an hour or two, as pauses need to be added to the capture loop to allow the renderer to stabilise the visual image, and write the screenshot to disk. During testing, if I moved the camera too rapidly I could alter the buffer contents before it was successfully written to disk, or I could take the screenshot during the eye adaptation changes, creating inconsistencies.
Cropping map tiles #

So now we have many many screenshots, each slightly offset from the other in a grid. The task ahead is to find out exactly the right centre crop of the screenshots such that each cropped image tiles perfectly with its neighbours. There are plenty of approaches within the Python ecosystem for stitching together images, OpenStitching or plain OpenCV for instance. These are mostly concerned with creating a single output image rather than keeping the sources as tiles, so they’re not as helpful as I first thought.
It’s also worth stating that I chose Python for this because it was the lingua franca when I worked in post-production, and the habit has stuck. The code is usually clear, the image processing libraries are numerous and mature, and support is widespread. While I was developing this on my Windows box, I used WSL to provide the runtime, although it could have just as easily been a native installation.
There are some unique properties of our images to exploit. Since we’ve ensured the spacing between each image is precisely controlled, there will be one square crop we can make which will work globally across the entire data set. We need only find the value once and we’re done.
The first step is to take an overly generous centre square of each screenshot and save it out as an intermediate tile. Stitching these together raw gives us obvious visual repetition at the borders, but we know we’ve still got the correct square somewhere in this image. Once we have these intermediate tiles, we can also delete the source screenshots. Efficiency!
The next step is to incorporate a dynamic overlap value we can control while running a script to produce a composite mosaic of our tiles. We don’t need anything sophisticated here, eyeballing the right overlap value was quick, and the right size for our tiles is 542 px.
You can see this approach in crop_screenshots.py which uses Python PIL to perform the image operations, and contains separate constants TILE_CROP_SIZE and TILE_OVERLAP.
A future piece of work will be to implement normalized cross-correlation using NumPy to find the correct cropping value automatically, but this isn’t necessary for the initial phase of this project. It’s important to recognise when you’re being pulled down a rabbit hole, and to keep version one simple.
When we have dialled in the required TILE_OVERLAP we bake this into a final export of our LOD 0 tile set, and move onto the JavaScript to bring it to life.
Implementing LeafletJS #
Having looked at a number of different browser-based mapping frameworks, let’s use LeafletJS. It’s very established, has plenty of implementation examples, and seems to have a good ecosystem of community plugins should I want to extend the UX functionality later.
So let’s briefly talk about coordinate systems and terminology. We’re about to smash two incompatible groups into each other, game developers and GIS people.

The Enfusion game engine sits in the CORRECT quadrant, the upper right 😊
+X is right, +Y is up and +Z is forward. The game world is flat, and all is good in the world. But wait, what’s that? We live on a sphere, and to use Latitude and Longitude to get around? Ut oh!

That’s right, LeafletJS was born out of needing to display real-world maps, so is fundamentally different from our rectilinear game world. Not only is there a spherical coordinate reference system, the map display thinks of the origin as being in the top left, and +Y is down.
To add insult to injury, we also have reversed thoughts on detail levels. So far I’ve named the tiles according to the game-dev LOD and Mipmap concepts. The ground truth is detail level 0, and all derivatives will become 1, 2, 3 etc., as we’re simplifying information and losing detail. Leaflet, however, thinks in terms of zoom levels. You start out at zoom level 0, furthest away from your subject and as you zoom further into the map, you get progressively more detailed tiles.
Coordinate problems are always a huge PITA. They can introduce sign, off-by-one and scale errors all over the place unless you’re disciplined. Thankfully LeafletJS has a number of approaches for tackling this, and makes it pleasant to work with with, once you know how to implement these conversions.
Firstly let’s tackle the coordinate flip. Our tiles have an origin in the bottom left, so we flip the Game Z coordinate as it’s converted into a Tile Y. We implement the following basic extension to the TileLayer class, and the +1 offset is there to account for flipping the origin from the bottom of the grid square to the top.
// Our custom tile layer which inverts the Y axis
L.TileLayer.InvertedY = L.TileLayer.extend({
  getTileUrl: function(tilecoords) {
    tilecoords.y = -(tilecoords.y + 1);
    return L.TileLayer.prototype.getTileUrl.call(this, tilecoords);
  }
});
Secondly, we need to invert the zoom numbering by adding zoomReverse: true to the tile layer, and specifying our maximum and minimum zoom levels.
// Configure our custom tile layer to use zoomReverse to match our Level Of Detail numbering
tileLayer = new L.TileLayer.InvertedY('LODS/{z}/{x}/{y}/tile.jpg', {
  maxZoom: MAX_ZOOM,
  minZoom: 0,
  zoomReverse: true,
  bounds: bounds,
}).addTo(map);
Lastly, we need to scale the coordinates correctly. This involves creating a custom Coordinate Reference System which scales the tiles such that the in-game coordinate system corresponds with the Leaflet coordinates. We firstly want to use L.Projection.LonLat as we want to specify coordinates in X, Z order. We also need to scale coordinates so that our tile size of 542 px is accounted for, where the standard tile size is 256 px.
  // Transformation() takes values to form a 2x2 linear transformation matrix
  L.CRS.CustomSimple = L.Util.extend({}, L.CRS, {
    projection: L.Projection.LonLat,
    transformation: new L.Transformation(1/12.501, 0, -1/12.501, 0),
    ...
  });
I’ve no clue why the scaling factor turns out to be 1/12.501. The whole CRS area of LeafletJS looked like a huge can of worms, so I ended up placing three map markers at the game coordinates of obvious visible landmarks and then tweaked the scaling factor until they all lined up. Good enough, let’s move on.
The final job is to create a couple of helper functions to add one last aspect of coordinate system conversion. There is a hidden offset in what we’ve created, and that’s the center origin of the tiles, vs the corner origin of LeafletJS. We need to account for this using the following:
// our tiles are 100 m, so it's 50 m to the centre
EDGE_TO_CENTER_OFFSET = 50

function gameCoordsToLatLng(gameCoordinate) {
  return L.latLng([gameCoordinate[2] + EDGE_TO_CENTER_OFFSET, coordPair[0] + EDGE_TO_CENTER_OFFSET]);
}

function latLngToGameCoords(latlng) {
  return [latlng.lng - EDGE_TO_CENTER_OFFSET, 0, latlng.lat - EDGE_TO_CENTER_OFFSET];
}
The final implementation of all the above can be seen in EnfusionMapMaker/Web/reforger-map.js.
Zoom levels #
Now we have a set of LOD 0 tiles, we can aggregate them into LOD 1, LOD 2 etc. The animation below shows how this system works. In the bottom left corner of each tile we’re printing the LOD level, and the X and Y coordinate. The coordinates are based on scaling by powers of two. The tiles bounded by 64,64 to 65,65 become a single tile at 32,32. Then the same again, tiles inside 32,32 to 33,33 become 16,16 and so on.
It’s extremely useful to be able to turn on a debug layer in the map, and see exactly what coordinates were being used to fetch tiles, and this can be achieved with the following GridLayer definition.
L.GridLayer.GridDebug = L.GridLayer.extend({
  createTile: function (coords) {
    const tile = document.createElement('div');
    tile.style.outline = '1px solid #111';
    tile.style.fontWeight = 'bold';
    tile.style.fontSize = '14pt';
    tile.style.color = 'red';
    tile.innerHTML = [MAX_ZOOM - coords.z, coords.x, -(coords.y+1)].join('/');
    return tile;
  }
});
The two maps in the base game of Arma Reforger are called Everon and Arland. On Everon we need 5 zoom levels, but on Arland we only need 4 as it’s much smaller. The code to do this is implemented in make_lod() and merge_tiles() which does a bounds query, a composite and a write across each of the tiles in the previous LOD.
Last I use Imagemagick’s Mogrify tool in the compress_tiles.sh shell script to optimise the filesize of the JPEGs. This finely controls the quality, chroma subsampling, the colourspace and interlacing. This could have been integrated into the Python code, but it’s better to treat this step as a requirement of making the website, so it’s entirely optional and using existing tools well optimised for the task.
Map stats #
At this stage we’re done with the map tiles. We have all our zoom levels, and we support the game coordinate system to plot positions accurately. Stepping back, it’s nice to get a sense of the scale of the thing we’ve just created, as it’s not particularly obvious when you’re down working in the details.
| Map name | Everon |
|---|---|
| Game area | 13 km x 13 km |
| Game distance per LOD 0 tile | 100 m |
| Tile image size | 542 x 542 px |
| Resolution | ~20 cm per pixel |
| Total tile storage | 398 MB |
| LOD filesizes (0-5) | 276 MB / 81 MB / 24 MB / 6.7 MB / 1.9 MB / 524 KB |
Extracting location data #
Now we have our map, with accurate scale, we now need to generate a set of coordinates for every hidden supply cache on the map. We first look for commonalities within the entity and prefab system.
Every supply cache has an inventory object you can interact with. This is usually in the form of a wooden post.

If we look at the component properties of this object in the Enfusion Workbench, we can see it contains two components which look unique to these types of object: InventoryItemComponent and SCR_ResourceComponent.

Now we know what components we’re looking for, we need to find out how to make the queries. Unfortunately there’s not a huge amount of documentation for making Enfusion editor tools. The best place to start is the Sample World Editor Tool that Bohemia have published. This gives us the following hint.
// Get World Editor module
WorldEditor worldEditor = Workbench.GetModule(WorldEditor);
// Get World Editor API
WorldEditorAPI api = worldEditor.GetApi();
World world = api.GetWorld();
With a World handle, we can use the method QueryEntitiesByAABB() to query and filter a list of objects. The two callback methods we have available control whether an object should be added, and then when it’s added, the callback controls whether the process should continue or not.
  // Init our array to store the entities
  m_entityResults = new array<IEntity>;

  // Declare our bounds
  vector queryBoundsMin = new Vector(0, 0, 0);
  vector queryBoundsMax = new Vector(13000, 200, 13000);

  // Perform our bounded query for entities
  bool queryResult = m_currentWorld.QueryEntitiesByAABB(
    queryBoundsMin,
    queryBoundsMax,
    filterEntitiesCallback,
    addEntitiesCallback,
    EQueryEntitiesFlags.ALL
  );

  // A basic test to look for both components being present
	bool filterEntitiesCallback(IEntity e) {
    if (e.FindComponent(SCR_ResourceComponent) &&
        e.FindComponent(InventoryItemComponent)) {
      return true;
    }

    return false;
  }

  // Find all the entities, so always return true
  bool addEntitiesCallback(IEntity e) {
		m_entityResults.Insert(e);
		return true;
	}
One feature of the Enfusion Workbench I love (and honestly there aren’t many) is a hyperlinked console log. When you print a raw IEntity with Print(entity) it will focus that object in the game camera, and select it in the hierarchy. This way you can easily confirm whether all the filtered objects are indeed the type you’re looking for.

Now we have our list of IEntity instances, we can write their position to a simple JSON file using the FileIO module.
FileHandle fh = FileIO.OpenFile("$profile:data.json", FileMode.WRITE);
if (fh) {
  fh.WriteLine("[");
  foreach(IEntity foundEntity : m_entityResults) {
    // Write a position array
    vector position = foundEntity.GetOrigin();
    string formattedLocationLine = string.Format("  [%1, %2, %3],", position[0], position[1], position[2]);
    fh.WriteLine(formattedLocationLine);
  }
  fh.WriteLine("]");
  fh.Close();
} else {
  Print("Failed to open file for writing");
}
And out pops the array of coordinates, ready for us to plot using LeafletJS.
[
  ...
  [3215.72, 4.00446737, 2948.74],
  [3231.16, 0.0918469, 2955.15],
  [3242.65, 0.20875, 2894.48],
  [3229.39, 3.1775, 2915.56],
  [3179.32, 9.6688, 2834.27],
  ...
]
So now we can simply import this data into our LeafletJS setup and plot the X and Z coordinates.
The finished map #

Success! We have our web page which accurately displays the location data, and everything is coming directly from the game engine 100% procedurally.
You can find the code on GitHub in nickludlam/EnfusionMapMaker, and a readme that takes you through most of the steps.
For the final website I took things a little further, using Svelte to provide page templating and deployment options. There were a couple of challenges relating to making the client-side LeafletJS library play nicely with Typescript and building a static version of the site, but that’s another thing which is out of scope for this particular article. The public repository contains the vanilla HTML and JavaScript to get everything working, and people can customise it as they like.
The current live implementation is https://reforger.recoil.org.
Some topographic fun #
Out of curiosity, I wanted to see what it would be like to combine the very flat composite map (effectively pure albedo) with the large-scale shading from the in-game base map from earlier. Simply compositing the layers using an overlay blend mode and some manipulation of the brightness ranges of the shaded map achieves the effect. I think it gives you a much better sense of where the mountainous areas are with the contrast in luminance and a stronger sense of the shallow water. It’s not physically realistic but it looks great.
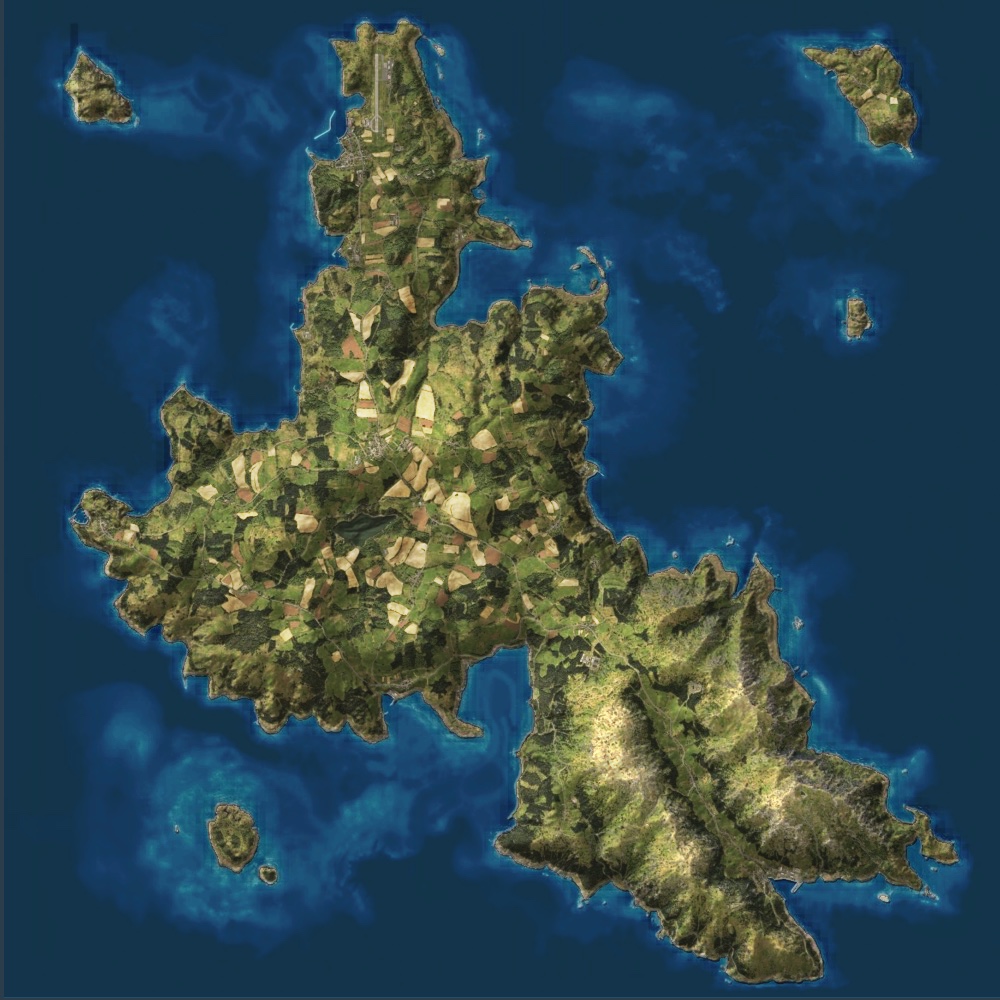
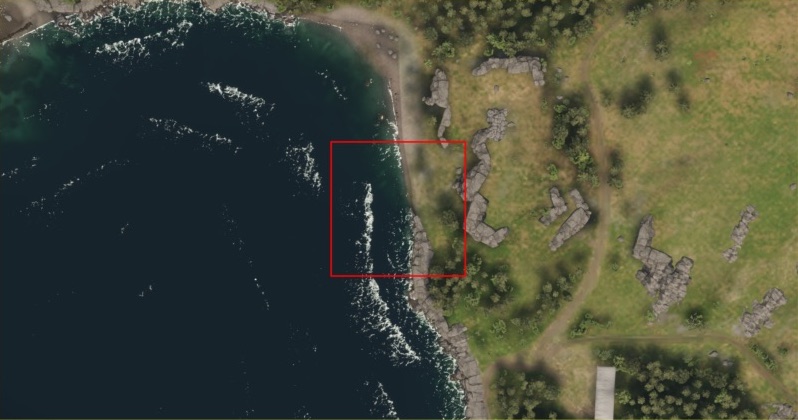
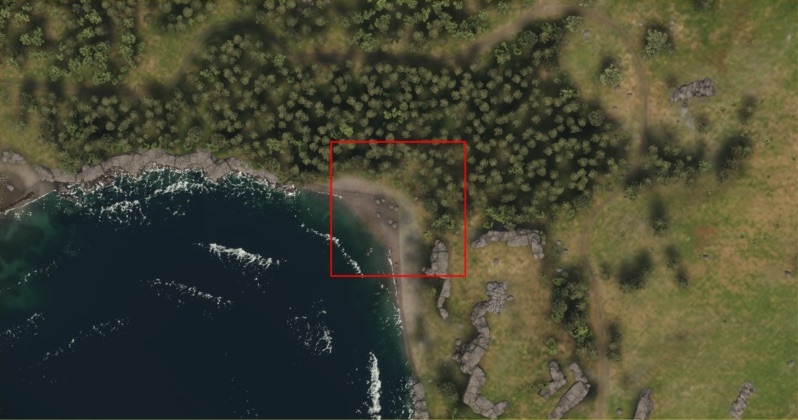
Comparison with the official map #
This shows a comparison between the official render of the island, likely based on the 2022 Houdini work, and my generated map tiles.
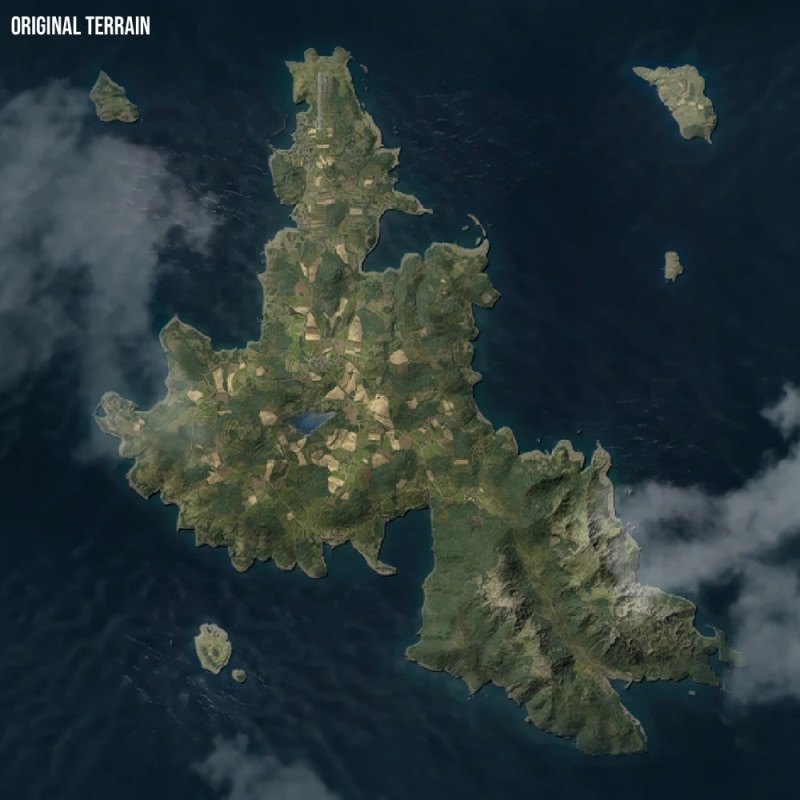
As you can see, the original topography and field layout is identical, with only the forest zones being changed. This could be down to performance or gameplay considerations.
Conclusion #
This was a fun little side project and took around 10 days in total, plus a little extra for this write-up and the git repository documentation. The website has proved to be very popular with players and now has hundreds of daily users, which makes me happy.
I think this is also a great project to highlight T-shaped skills. This kind of challenge can help encourage developers to push outside their comfort zone, and they can discover that their skills are more easily transferred into other domains than they may have first thought. You may not be a professional game developer, but that doesn’t stop you from picking up enough to achieve what you want from a game engine.
It’s also a good example of sticking to an MVP deliverable. It’s no fun adding another half-completed project to the pile, and there’s no shame in taking some shortcuts to get your work out the door. You can always return later and improve things incrementally.
Many thanks to Tom Armitage and Ian McEwan for feedback and help with this write-up.